GRAND PhD student Vinu Subashini Rajus attended the SmartGeometry 2011 workshop and conference in Copenhagen, Denmark from March 24 - April 4. A Ph.D. candidate in Interactive Arts & Technology at Simon Fraser University, Vinu prepared the following summary of her experience.
SmartGeometry 2011 was held in the Royal Academy of Fine Arts School of Architecture in the Center for Information Technology and Architecture (CITA), Copenhagen. The conference had two distinct parts: four days of intensive workshop and a two-day public conference with a talkshop session, workshop exhibition and public symposium. Dynamic photos of the SmartGeometry 2011 conference can be found here.
The theme of this year’s conference was ‘Building the Invisible’. It challenged delegates to incorporate real world data with design processes and to discuss how this information could influence design.
Though the two-day conference was open to the public, one had to apply to attend the workshop. I was very eager to participate in the workshop since the conference theme related to my thesis. My thesis is on incorporating occupant behavior with performance data and how this information can influence design choices. I was even more excited when I found out I had been accepted.
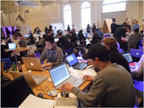
The workshop was exhilarating and exhausting. Architects, designers and engineers from around the world came together to collaborate, research, innovate and prototype ideas.
 The workshop consisted of ten clusters (or groups), each with a challenging topic like Reflective Environments, Using the Force, Interacting with the City, Authored Sensing, or Urban Feeds. Each group had their own project ideas.
I was part of the Reflective Environments Cluster, comprised of 17 people representing industry, research labs and graduate programs.
Our first task was to capture occupancy data from the workshop participants. Occupancy data maps the cluster arrangements that form, how the group splits into different smaller groups and how the instruments being used execute the tasks at hand.
In terms of technology, we decided on a wireless Enistic application with a smart meter plug-in in order to capture electricity consumption. We captured electricity consumption on laptops and other instruments being used for the projects. The data was continuous. In addition, we used thermal cameras, fixed on the ceiling, to capture the occupants during the workshop. We collected these two sets of information to see whether there was any relation between the occupants’ activities and energy consumption.
Once the data was collected, we moved on to the next task, experimenting with different platforms to integrate and visualize the data. We tried 3dsMax, Processing, GenerativeComponents and Grasshopper. Finally,we decided on Processing for generating continuous information visualization and another 3D software for printing models.
We faced quite a few challenges integrating the data with information for design because the data collected was not tracked with the same standard of measurement. Plus, the amount of data was immense. In the end, we created different visualization designs and overlapped the information for display. 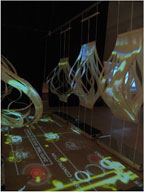
At the same time other members of our team worked on the installation component. They created a hanging sculpture based on fish gills as the concept to represent the collective energy consumption of the ten clusters. They set it up so that when the total amount of energy consumed was high, the gills compressed. When energy consumption was low, the gills relaxed noticeably.
Though we were able to represent the information about the energy consumed visually and physically, how this data would influence the design process was still a question. One that we did not have enough time to resolve.
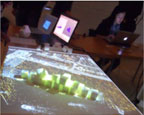 Of the other clusters, I found Interacting with the City interesting. They created a tangible, multi-dimensional, table prototype of the city using real-time and historical data collected from social platforms like Facebook, Twitter, and Google maps. In one of their projects they used historical weather data to simulate the flow of air around the building blocks of Ofelia Beach. Using Kinect to scan the 3D building blocks was a great idea because one could play around with the position of the blocks and observe the resulting wind flow pattern. This type of modeling helps designers during site planning and for optimizing building shapes more aerodynamically.
During the workshop, industry professionals such as GRAND researcher and SmartGeometry committee member Dr. Robert Woodbury, Simon Fraser University, along with others, helped the clusters when we were unable to solve complicated coding issues. Dr. Woodbury also gave a lecture on the system he wrote about in his book Elements of Parametric Design.
After an intensive four days, the prototypes, from each cluster, were exhibited to the group and open for public viewing.
Following the workshop, we had the public portion of the conference to attend. A highlight was listening to the industry speakers. Ben van Berkel from UN studio spoke about projects where his studio had used data for design and represented it visually. Usman Haque (Haque Design + Research) spoke about Pachube’s infrastructure on visualizing and monitoring data. The other speakers were Billie Faircloth (KieranTimberlake), Craig Schwitter (Buro Happold + Adaptive Building Initiative), Lisa Amini (IBM Smarter Cities Lab), and Mette Ramsgaard Thomsen (CITA) who all had amazing things to say.
SmartGeometry 2011 was a great conference where I had an opportunity to meet and work with interesting people from a diverse range of backgrounds and countries. A number of projects and research exploration done by the clusters related to GRAND’s projects such as ENCAD, AESTHVIS, CAPSIM, GRNCTY, and HCTSL. SmartGeometry 2011 was an engaging and innovative place for talented and creative people with unique project ideas. I highly recommend applying to and/or attending next year’s event.
SmartGeometry 2012 will be held March 19-24 at Rensselaer Polytechnic Institute in Troy, New York.